8 Enzymes
Enzymes are macromolecular biological catalysts. The molecules upon which enzymes may act are called substrates and the enzyme converts the substrates into different molecules known as products. Almost all metabolic processes in the cell need enzyme catalysis in order to occur at rates fast enough to sustain life. Metabolic pathways depend upon enzymes to catalyze individual steps. Enzymes are known to catalyze more than 5,000 biochemical reaction types. Most enzymes are proteins, although a few are catalytic RNA molecules. The latter are called ribozymes. Enzymes’ specificity comes from their unique three-dimensional structures.
Like all catalysts, enzymes increase the reaction rate by lowering its activation energy. Some enzymes can make their conversion of substrate to product occur many millions of times faster. An extreme example is orotidine 5’-phosphate decarboxylase, which allows a reaction that would otherwise take millions of years to occur in milliseconds. Chemically, enzymes are like any catalyst and are not consumed in chemical reactions, nor do they alter the equilibrium of a reaction. Enzymes differ from most other catalysts by being much more specific. Enzyme activity can be affected by other molecules: inhibitors are molecules that decrease enzyme activity, and activators are molecules that increase activity. Many therapeutic drugs and poisons are enzyme inhibitors. An enzyme’s activity decreases markedly outside its optimal temperature and pH.
Some enzymes are used commercially, for example, in the synthesis of antibiotics. Some household products use enzymes to speed up chemical reactions: enzymes in biological washing powders break down protein, starch or fat stains on clothes, and enzymes in meat tenderizer break down proteins into smaller molecules, making the meat easier to chew.
In this laboratory, we will study the effect of temperature, concentration and pH and on the activity of the enzyme catalase. Catalase speeds up the following reaction:
2 H2O2 -> 2 H2O + O2
Hydrogen peroxide is toxic. Cells therefore use catalase to protect themselves. In these experiments, we will use catalase enzyme from potato.
The first experiment will establish that our catalase works (positive control) and that our reagents are not contaminated (negative control).
Hydrogen peroxide will not spontaneously degrade at room temperature in the absence of enzyme. When catalase is added to hydrogen peroxide, the reaction will take place and the oxygen produced will lead to the formation of bubbles in the solution. The height of the bubbles above the solution will be our measure of enzyme activity (Figure 8.2).
8.1 Positive and negative controls (Experiment 1)
8.1.1 Experimental procedures
- Obtain and label three 15 ml conical plastic reaction tubes.
- Then to Tube 1
- Add 1 ml of potato juice (catalase) to tube 1 (use a plastic transfer pipette).
- Add 4 ml of hydrogen peroxide to tube 1. Swirl well to mix and wait at least 20 seconds for bubbling to develop.
- Use a ruler (Figure 8.1) and measure the height of the bubble column above the liquid (in millimeters; use the centimeter scale of the ruler) and record the result in Table 8.1.
- Then to Tube 2
- Add 1 ml of water.
- Add 4 ml of hydrogen peroxide. Swirl well to mix and wait at least 20 seconds.
- Measure the height of the bubble column (in millimeters) and record the result in Table 8.1.
- Then to Tube 3
- Add 1 ml of potato juice (catalase).
- Add 4 ml of sucrose solution. Swirl well to mix; wait 20 seconds.
- Measure the height of the bubble column and record the result in Table 8.1.
| Tube # | Height of bubbles (mm) |
|---|---|
| 1 | |
| 2 | |
| 3 |
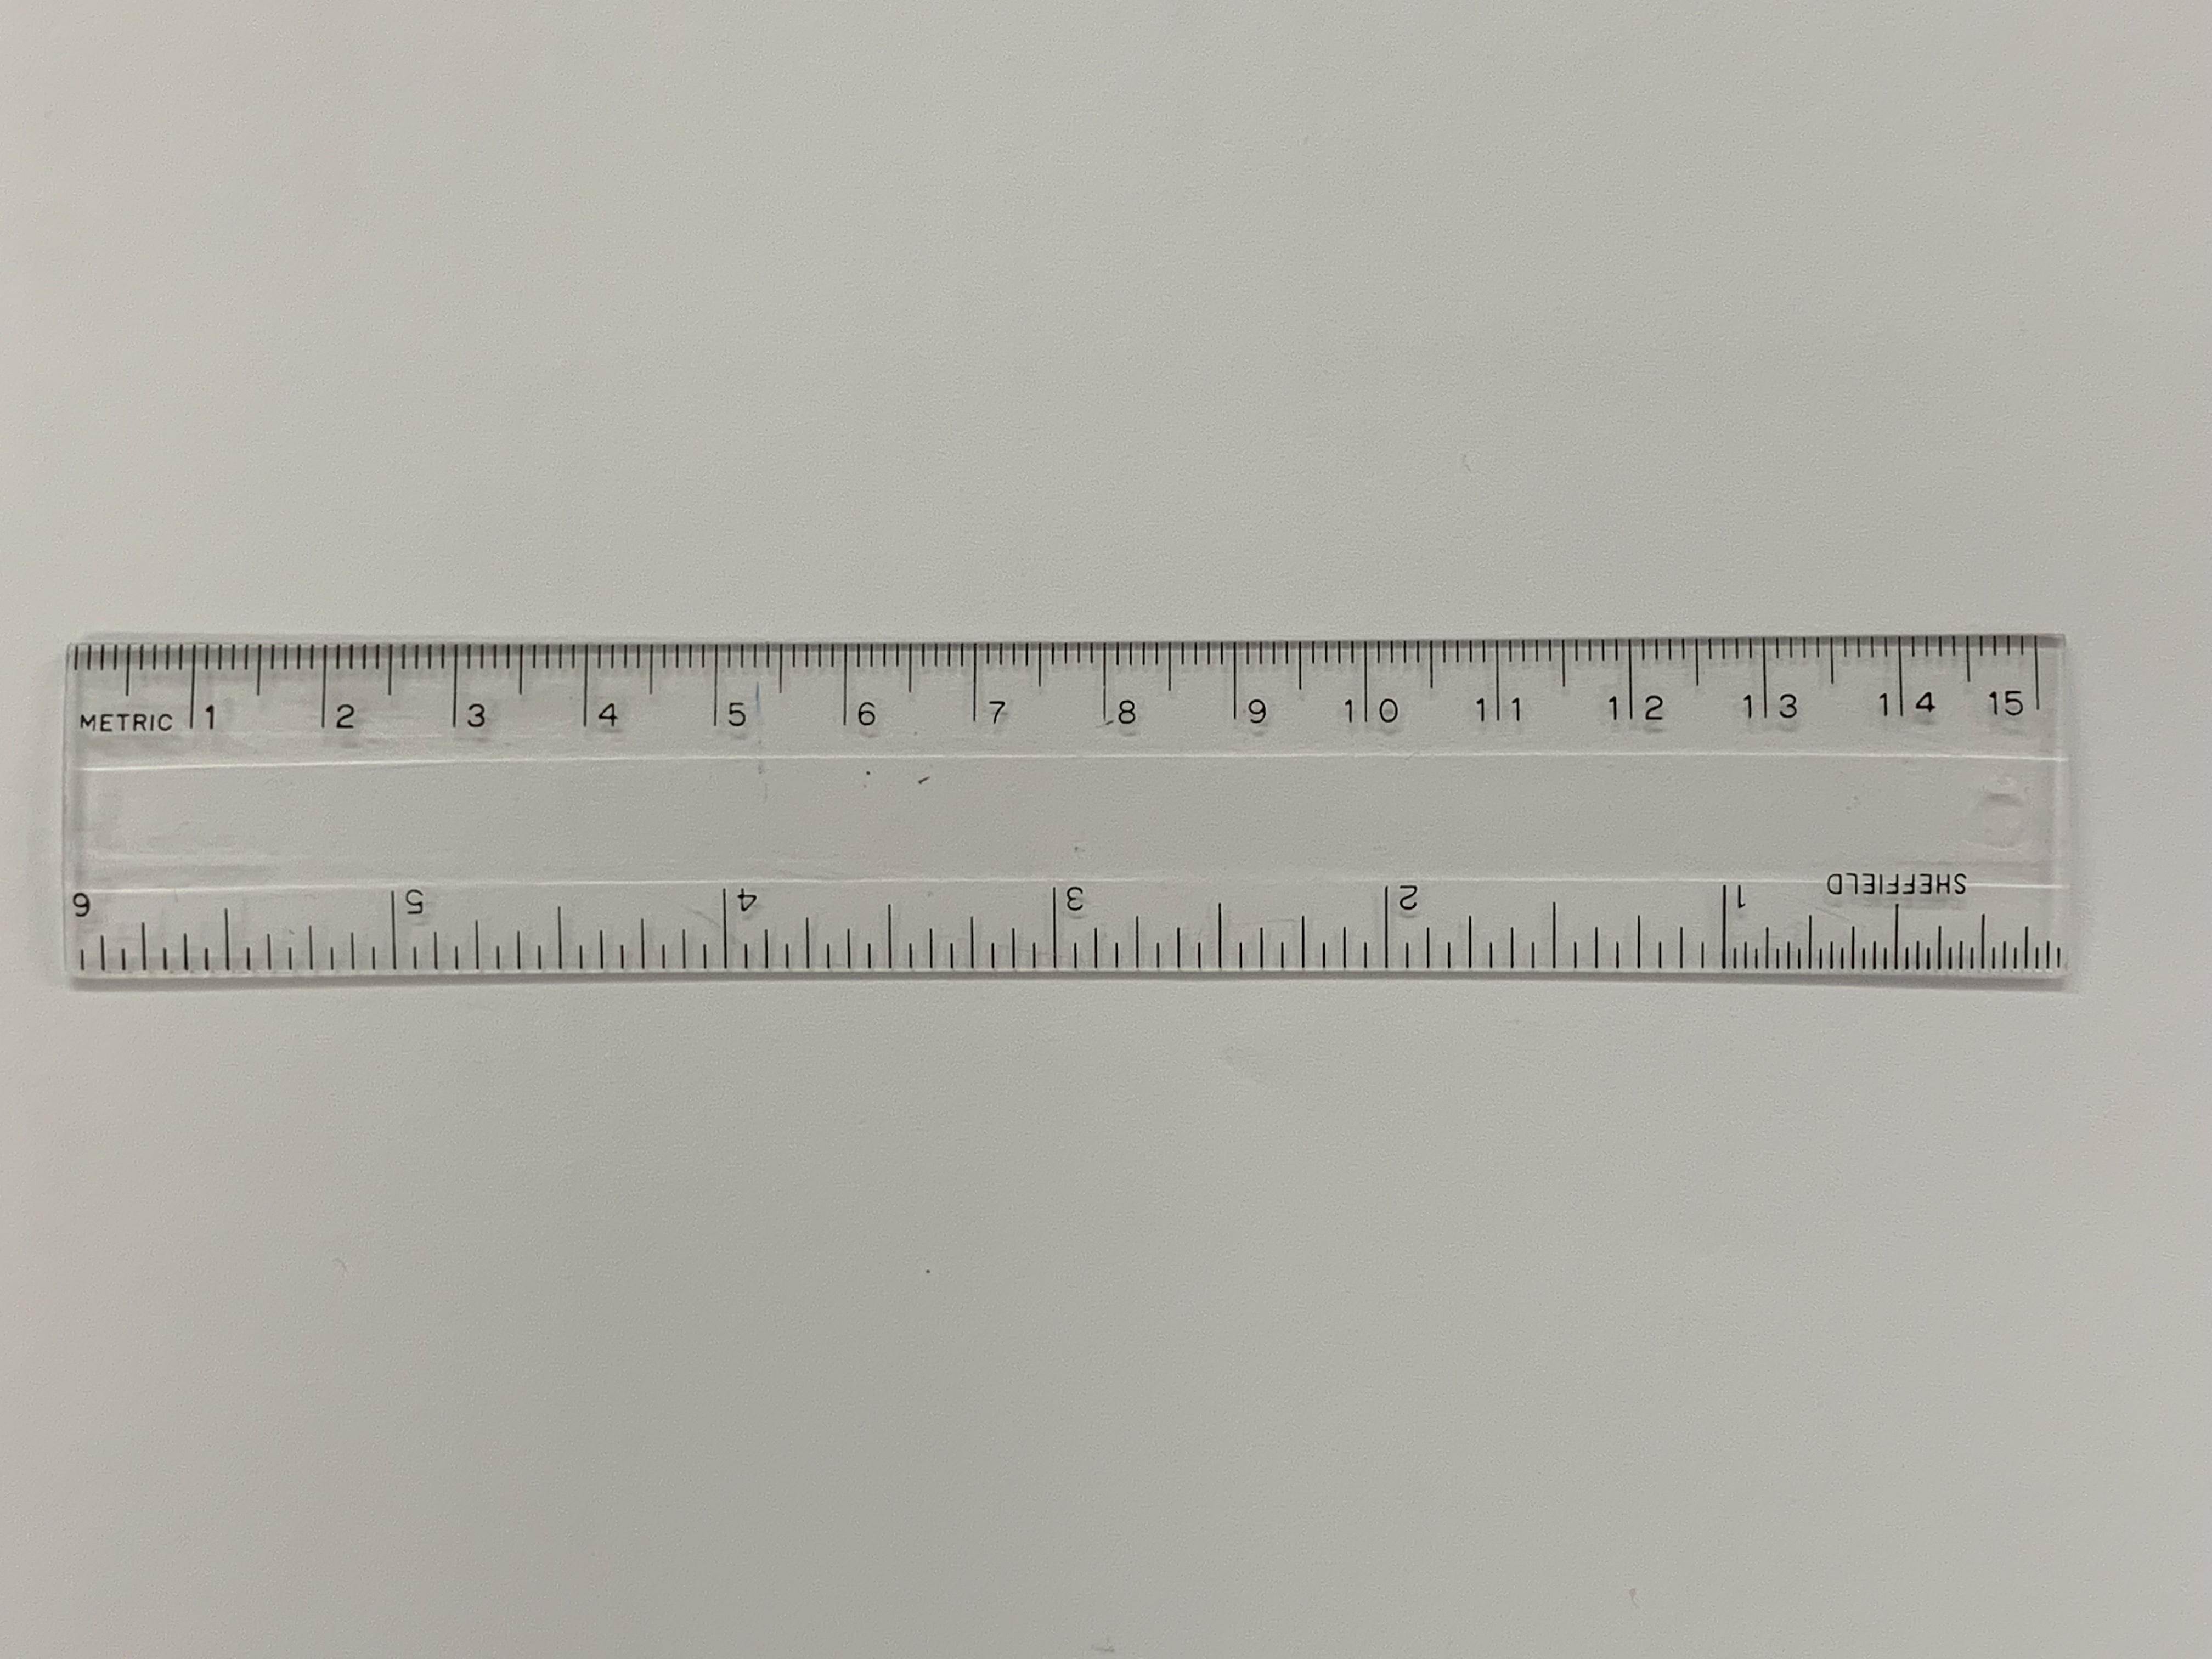
Figure 8.1: A ruler with metric (cm) and imperial (inch) scales.
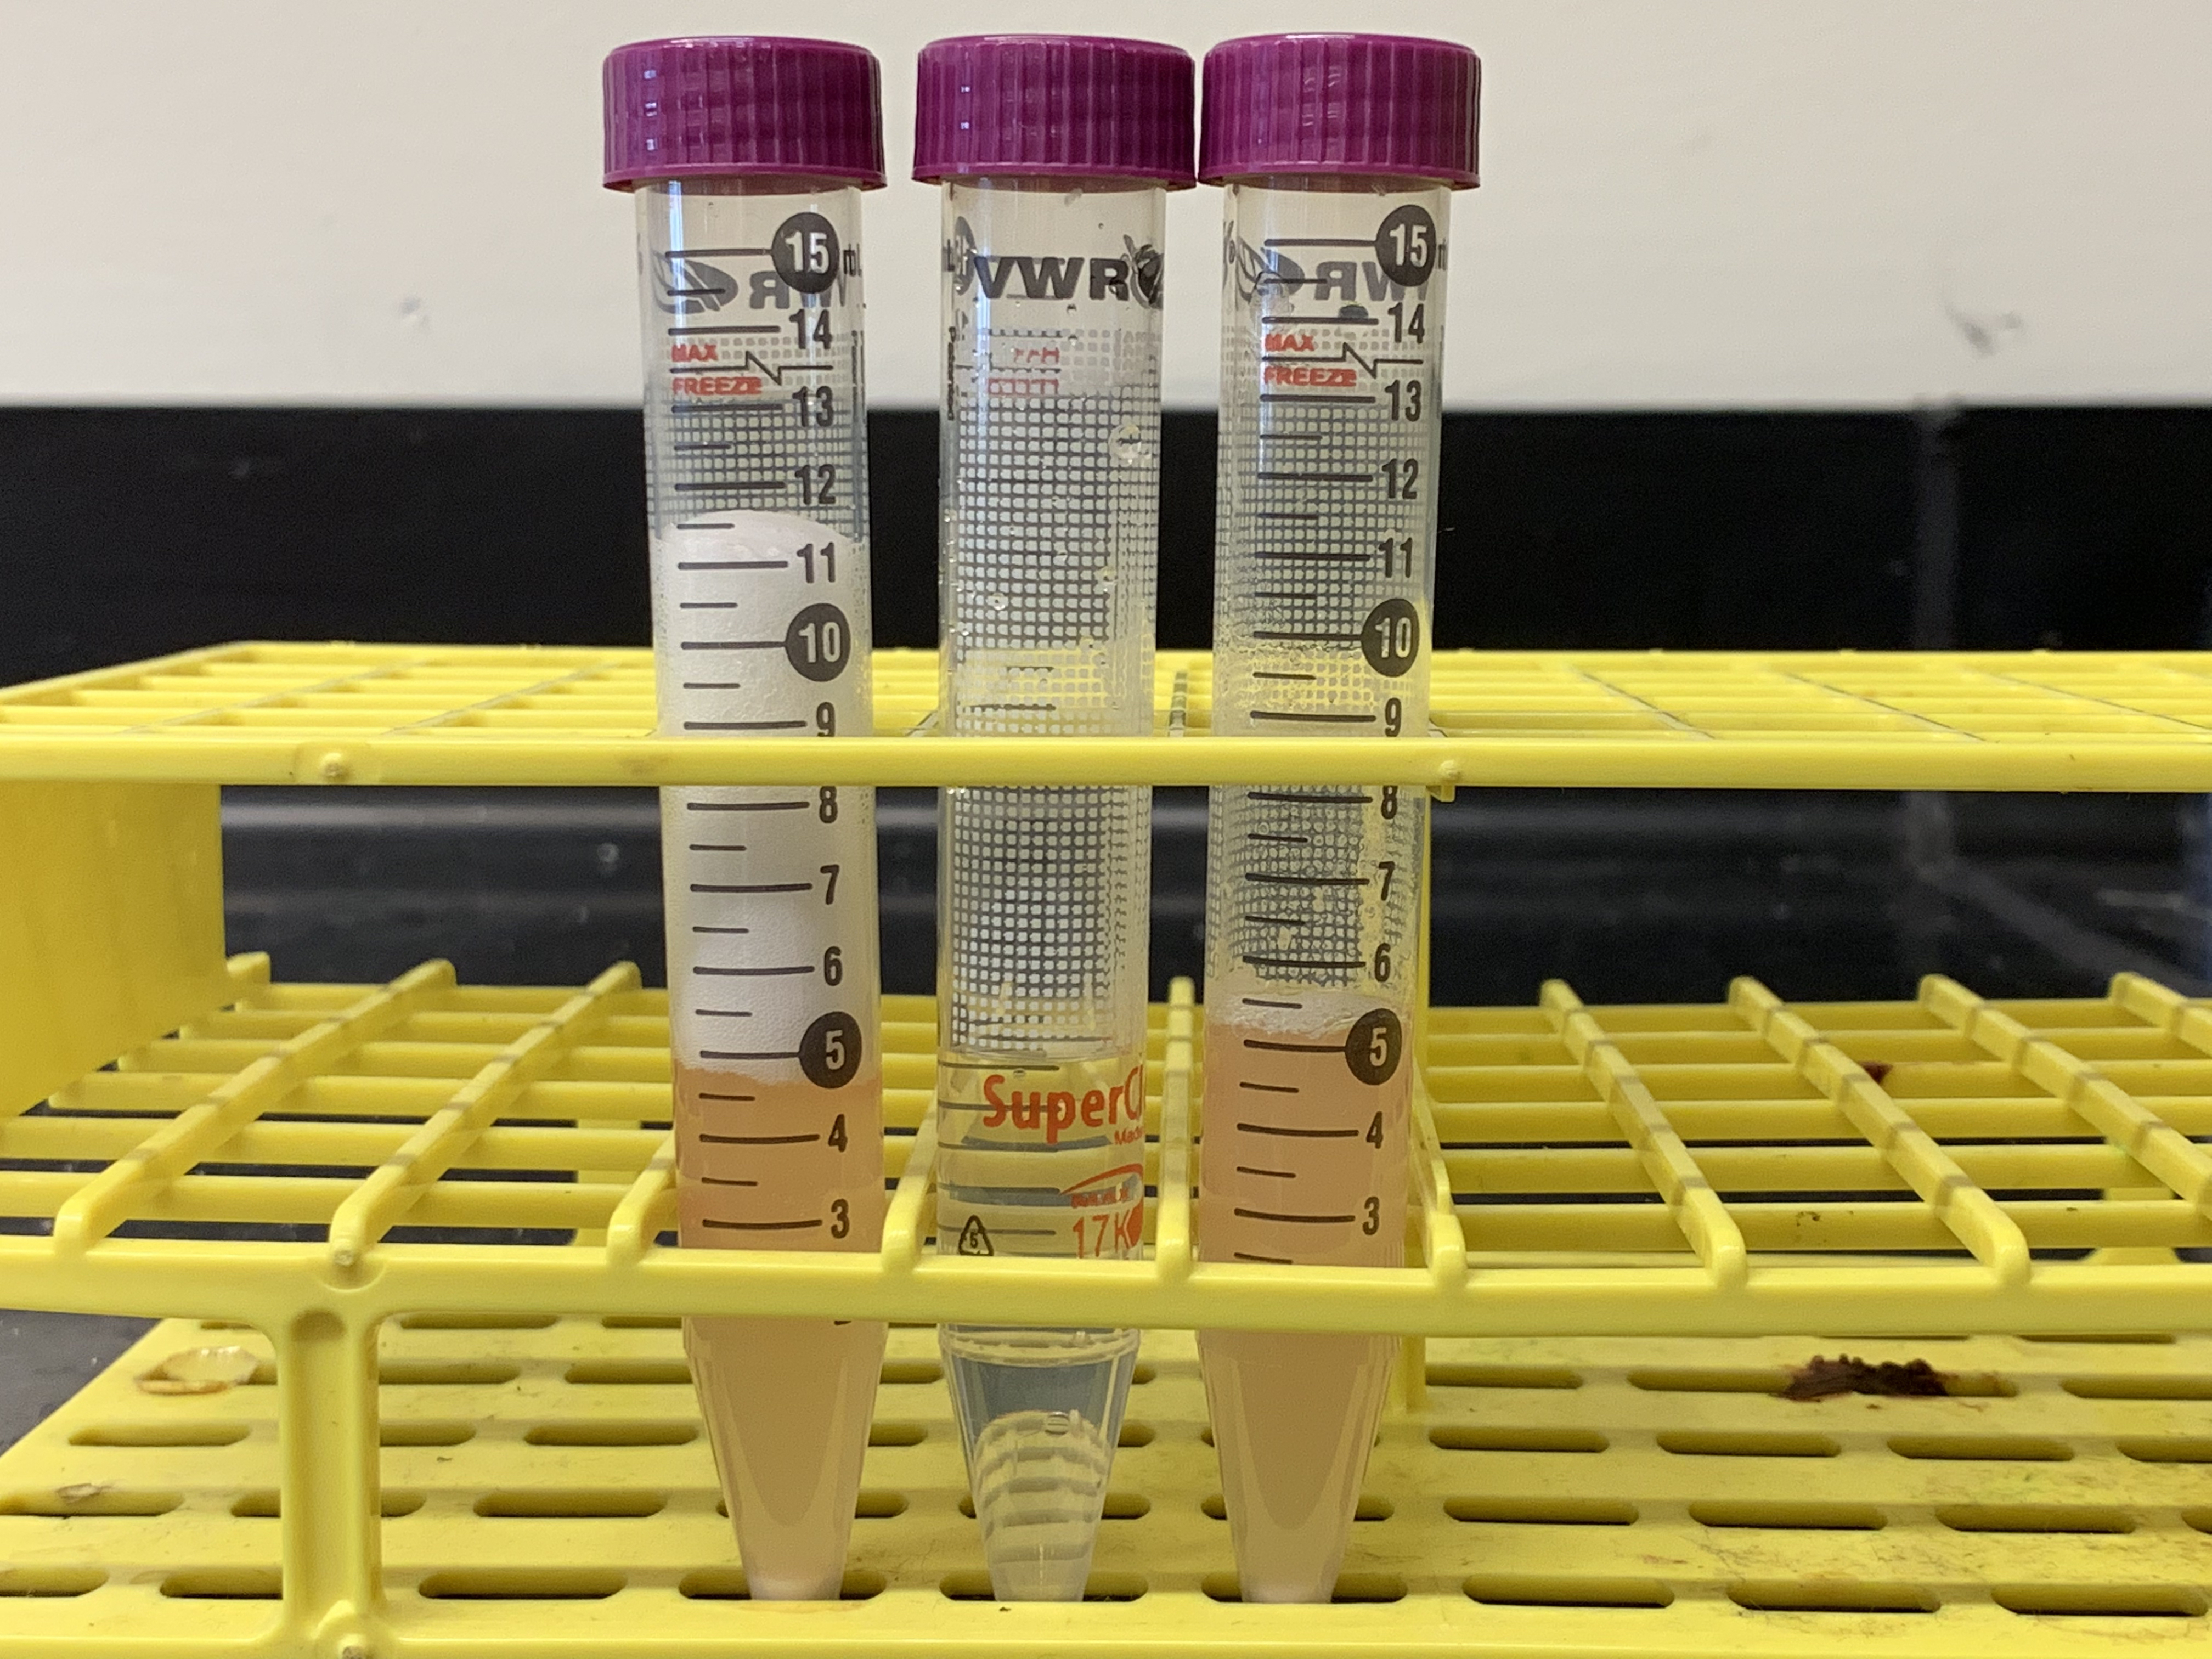
Figure 8.2: Results from experiment 1. The tubes in the picture correspond from left to right to tubes 1 to 3 in table 8.1. What conclusions can you draw from the results of this experiment as shown in this figure?
8.2 Effect of temperature on enzyme activity (Experiment 2)
8.2.1 Experimental procedures
Before you begin with the actual experiment, write down in your own words the hypothesis for this experiment:
Obtain and label three tubes.
Add 1 ml of potato juice (catalase) to each tube.
Place tube 1 in the refrigerator, tube 2 in a 37 °C (Celsius) heat block, and tube 3 in a 97 °C heat block for 15 minutes.
Remove the tubes with the potato juice (catalase) from the refrigerator and heat blocks and immediately add 4 ml hydrogen peroxide to each tube.
Swirl well to mix and wait 20 seconds.
Measure the height of the bubble column (in millimeters) in each tube and record your observations in Table 8.2.
Do the data support or contradict your hypothesis?
| Tube # | Height of bubbles (mm) |
|---|---|
| 1 | |
| 2 | |
| 3 |
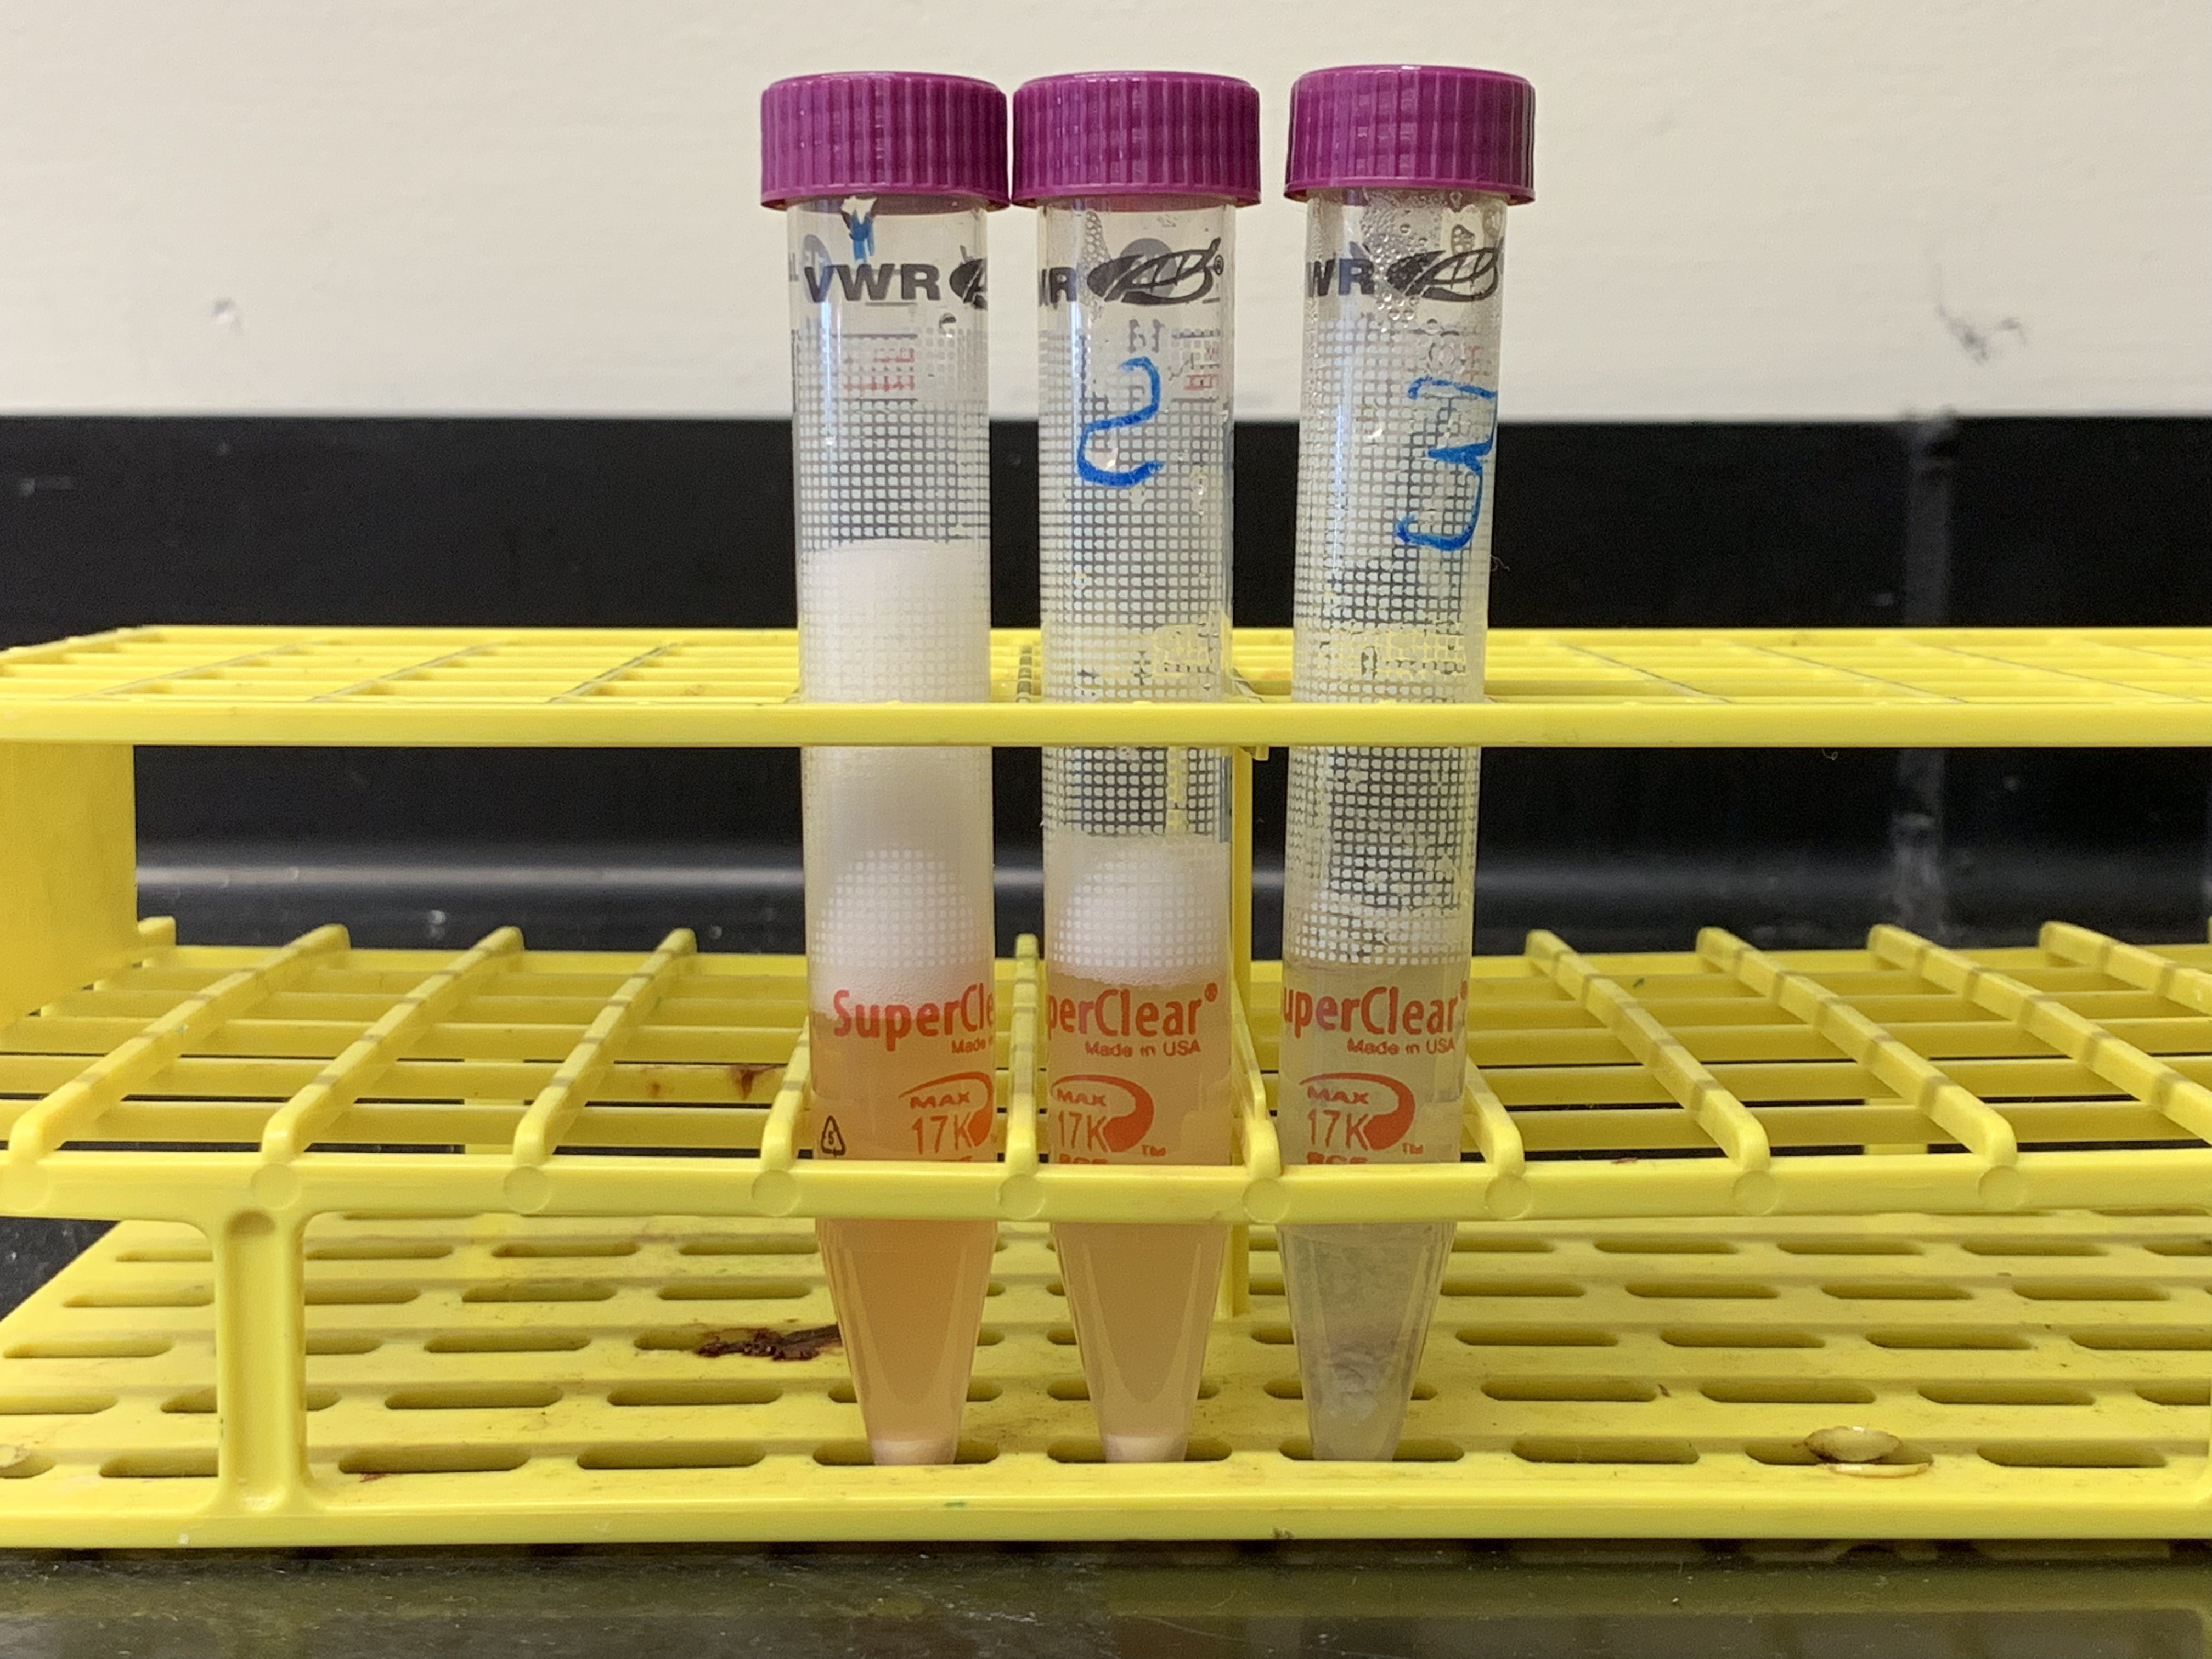
Figure 8.3: Results from experiment 2. The tubes in the picture correspond from left to right to tubes 1 to 3 in table 8.2. What conclusions can you draw from the results of this experiment as shown in this figure?
8.3 Effect of concentration on enzyme activity (Experiment 3)
8.3.1 Experimental procedures
Before you begin with the actual experiment, write down in your own words the hypothesis for this experiment:
Obtain and label three tubes.
Then to Tube 1
- Add 1 ml of water.
- Add 4 ml of hydrogen peroxide. Swirl well to mix and wait at least 20 seconds.
- Measure the height of the bubble column (in millimeters) and record your observations in Table 8.3.
Then to Tube 2
- Add 1 ml of potato juice (catalase).
- Add 4 ml of hydrogen peroxide. Swirl well to mix and wait at least 20 seconds.
- Measure the height of the bubble column (in millimeters) and record your observations in Table 8.3.
Then to Tube 3
- Add 3 ml of potato juice (catalase).
- Add 4 ml of hydrogen peroxide. Swirl well to mix and wait at least 20 seconds.
- Measure the height of the bubble column (in millimeters) and record your observations in Table 8.3.
Do the data support or contradict your hypothesis?
| Tube # | Height of bubbles (mm) |
|---|---|
| 1 | |
| 2 | |
| 3 |
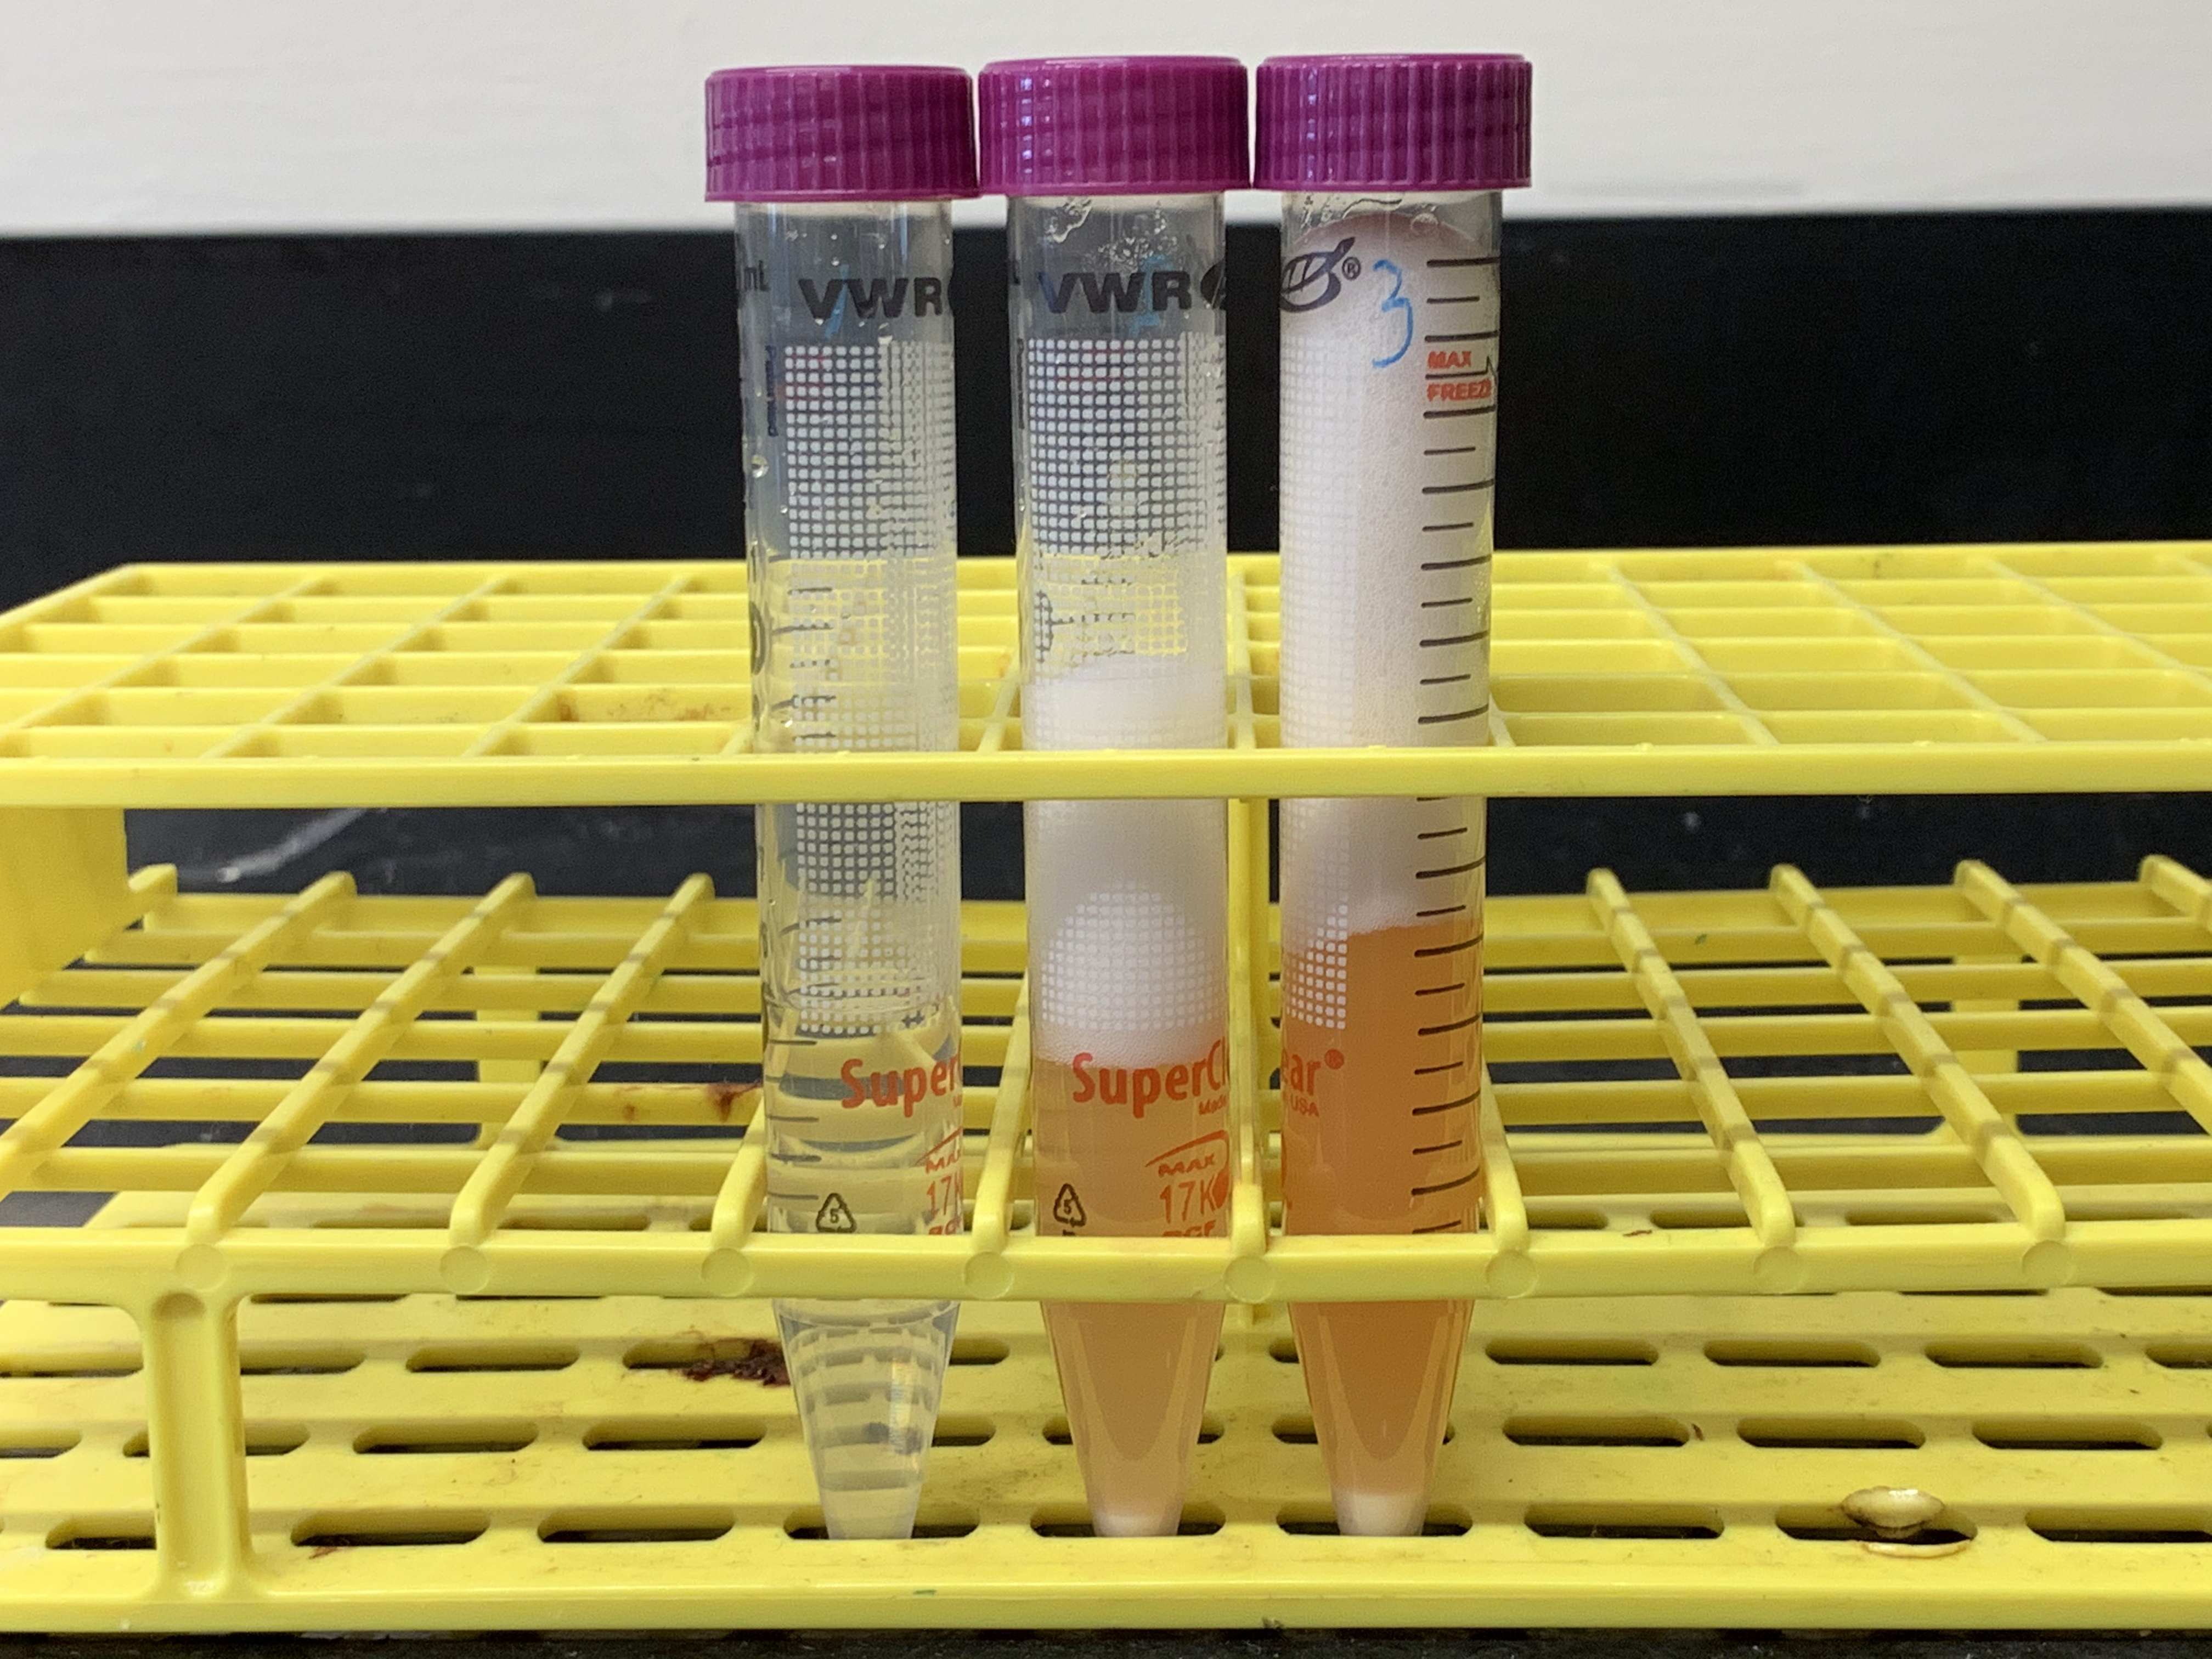
Figure 8.4: Results from experiment 3. The tubes in the picture correspond from left to right to tubes 1 to 3 in table 8.3. What conclusions can you draw from the results of this experiment as shown in this figure?
8.4 Effect of pH on enzyme activity (Experiment 4)
8.4.1 Experimental procedures
Before you begin with the actual experiment, write down in your own words the hypothesis for this experiment:
Obtain 6 tubes and label each tube with a number from 1 to 6.
Place the tubes from left (tube #1) to right (tube #6) in the first row of a test tube rack.
Add to 1 ml of potato juice (catalase) to each tube.
Add 2 ml of water to tube 1.
Add 2 ml of pH buffer 3 to tube 2.
Add 2 ml of pH buffer 5 to tube 3.
Add 2 ml of pH buffer 7 to tube 4.
Add 2 ml of pH buffer 9 to tube 5.
Add 2 ml of pH buffer 12 to tube 6.
Add 4 ml of hydrogen peroxide to each of the six tubes.
Swirl each tube well to mix and wait at least 20 seconds.
Measure the height of the bubble column (in millimeters) in each tube and record your observations in Table 8.4.
Do the data support or contradict your hypothesis?
| Tube # | Height of bubbles (mm) |
|---|---|
| 1 | |
| 2 | |
| 3 | |
| 4 | |
| 5 | |
| 6 |
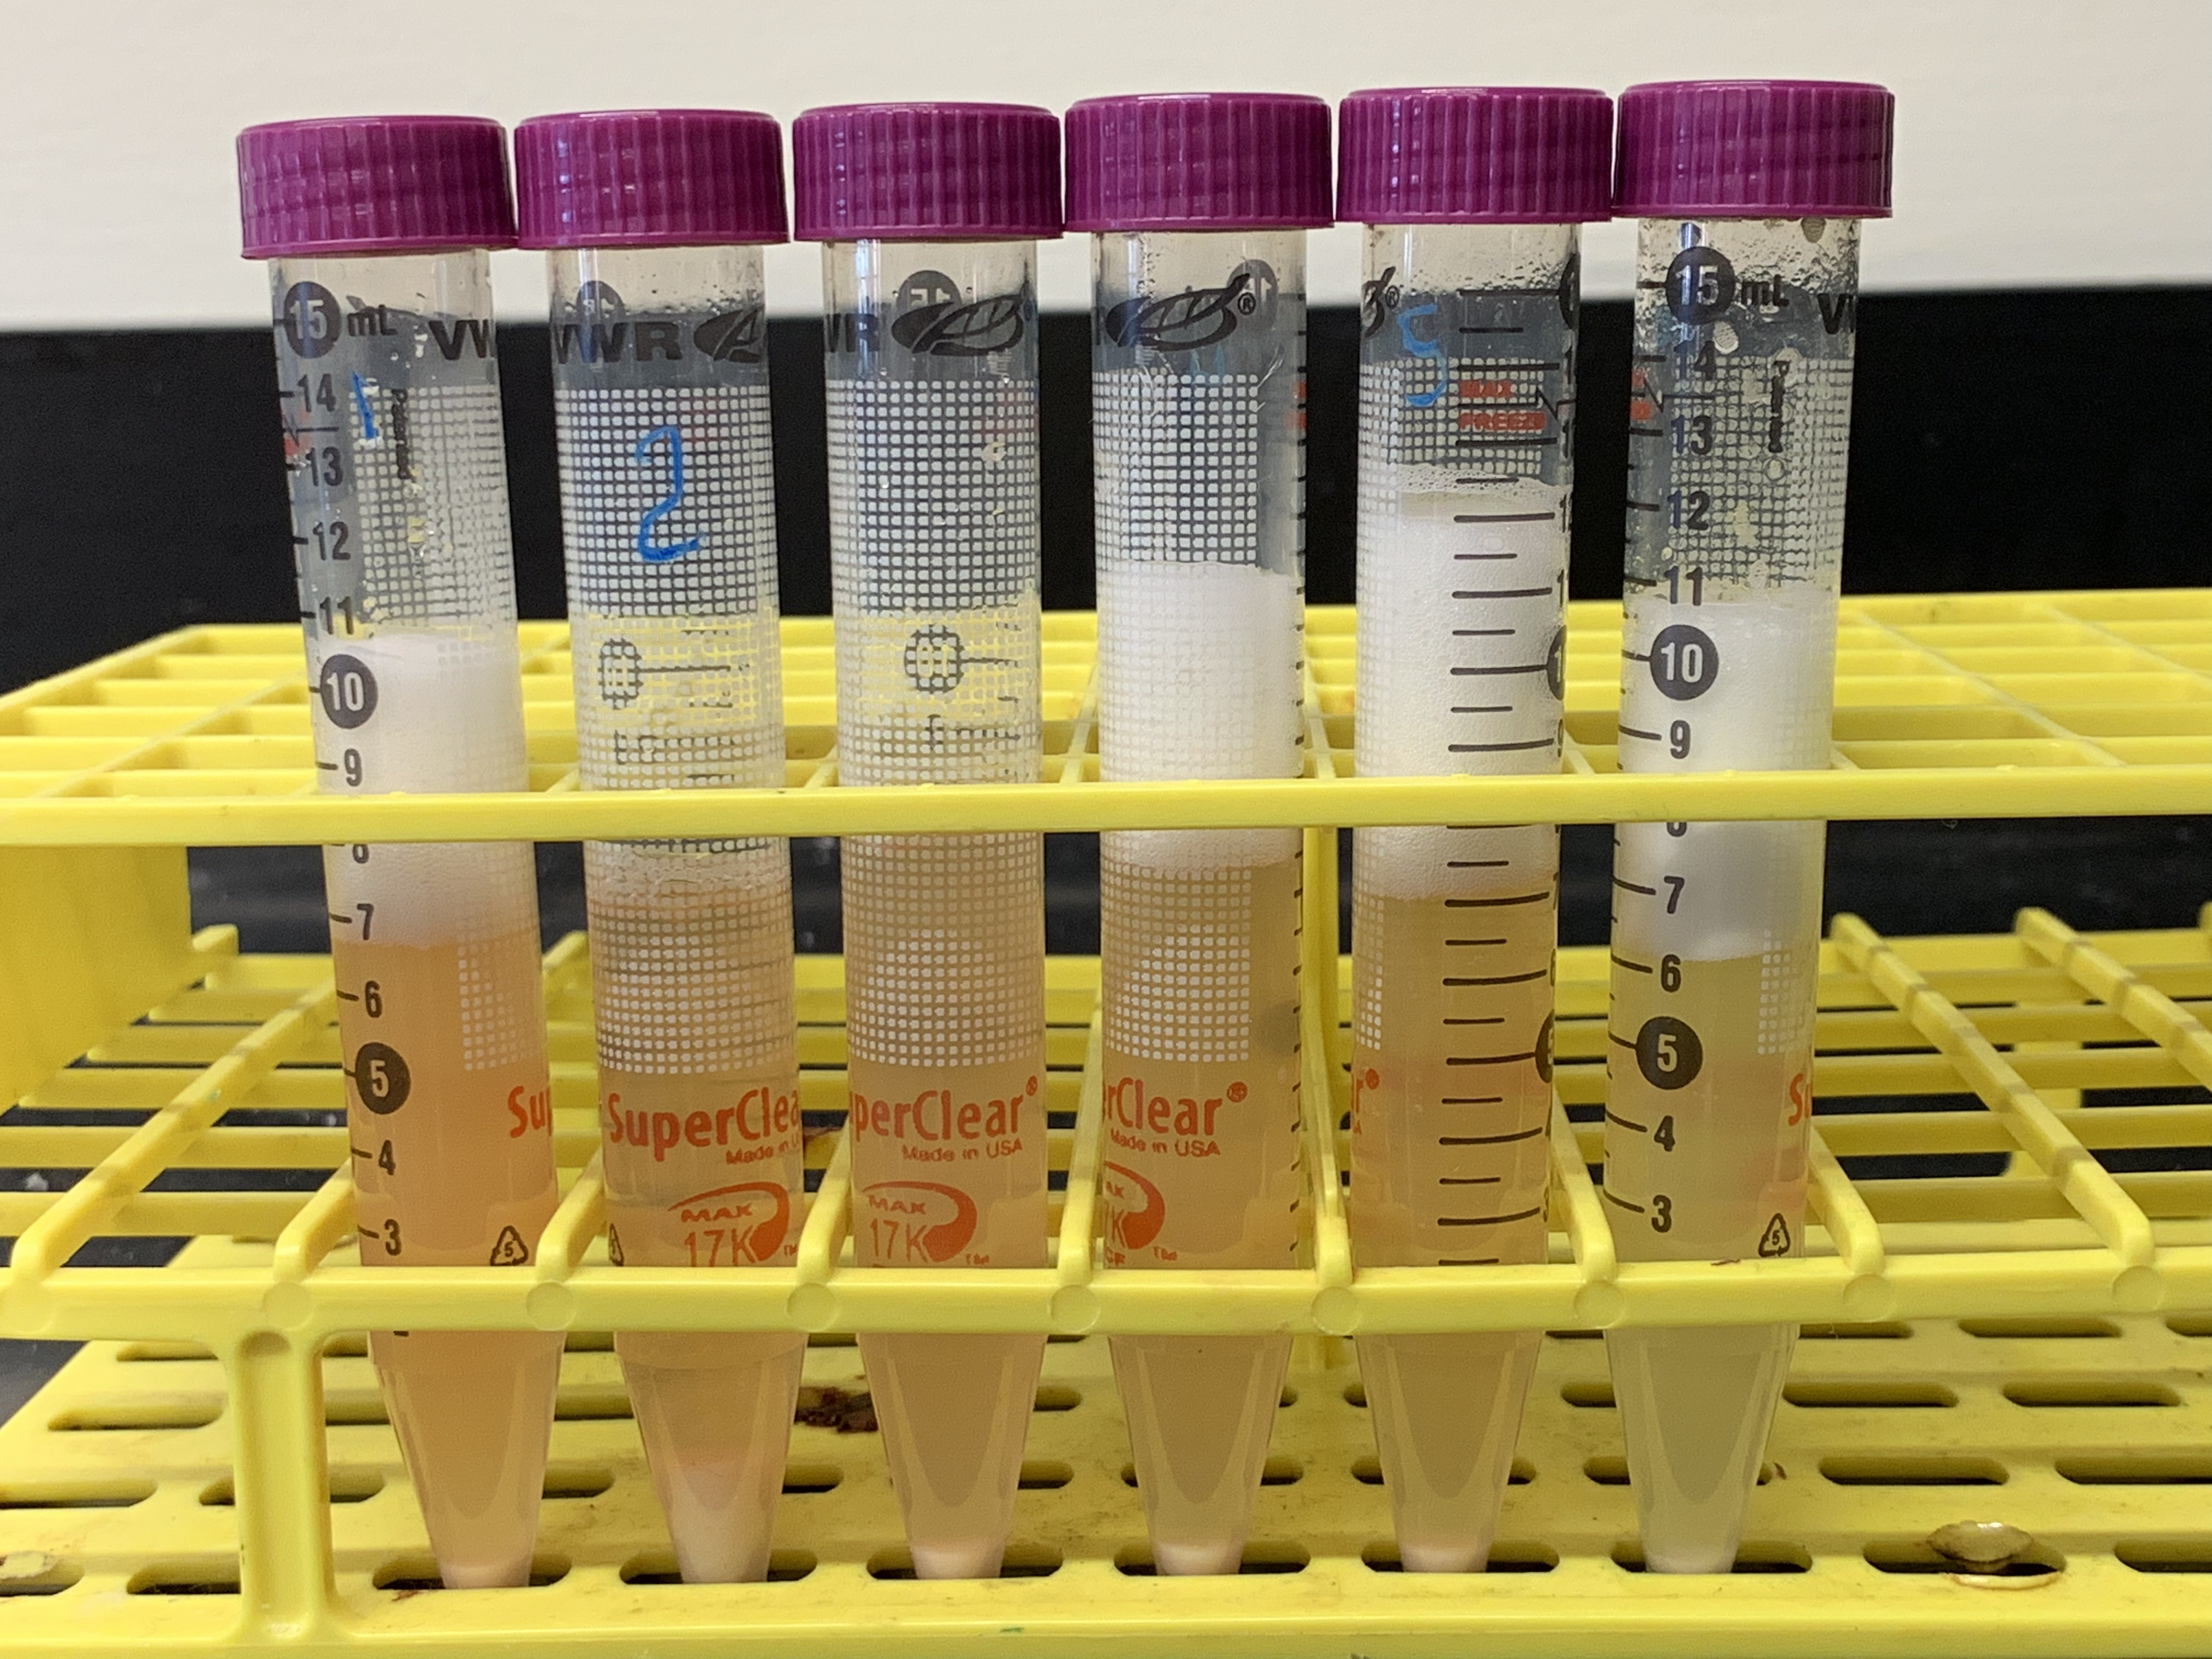
Figure 8.5: Results from experiment 4. The tubes in the picture correspond from left to right to tubes 1 to 6 in table 8.4. What conclusions can you draw from the results of this experiment as shown in this figure?

Figure 8.6: Catalase activity is dependent on pH. The data shown in this figure were obtained by three groups of students during a previous laboratory session. The triangles represent the data from the experimental results shown in Figure 8.5.
8.5 Cleaning up
- Empty the contents of the plastic tubes into the labeled waste container (brown bottle) in the chemical fume hood.
- Discard the empty tubes and other waste in the regular waste basket.
- Rinse the glass rod and glassware with water and detergent.
- Return the glass ware to the trays on your bench where you originally found them.
8.6 Review Questions
- What is a catalyst?
- What are enzymes?
- What is the name of the enzyme that we studied in this laboratrory session?
- What is an enzyme substrate?
- What is the substrate of the enzyme that we used in this laborator seesion?
- What are the products of the reaction that was catalized by the enzyme that we studied in this laboratory seesion?
- What is the active site of an enzyme?
- What is the purpose of the negative and positive controls?
- State the hypothesis that was tested in experiment 2?
- State the hypothesis that was tested in experiment 3?
- State the hypothesis that was tested in experiment 4?
- The enzyme from potato appeared to work better at 4 °C than at 37 °C. Would you expect the same if we had used the equivalent human enzyme? Justify your answer.
- Why did heating the enzyme at high temperature (> 65 °C) result in loss of activity?